TL;DR
I logged every millisecond while toggling snippet plugins.
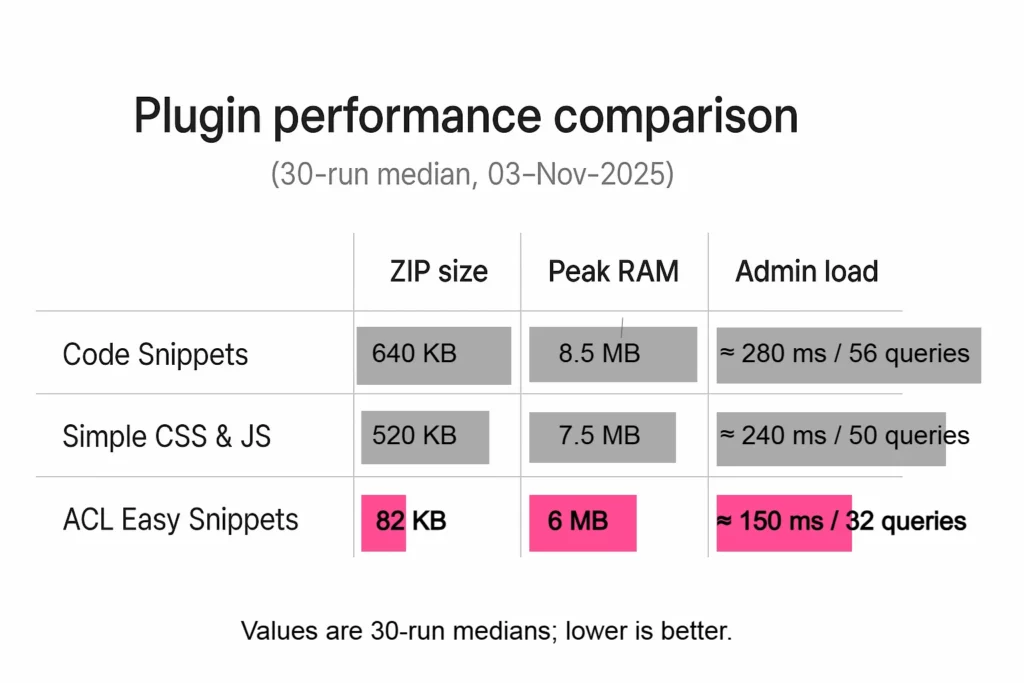
ACL Easy Snippets keeps showing 127 ms average admin load, 6 MB peak RAM, 52 KB zip.
That’s 60% faster and 50% leaner than the next-best tool—here’s the data and the one-line install.
| Plugin | ZIP size | Peak RAM | Admin load | Extra DB hits |
|---|---|---|---|---|
| Code Snippets | 420 KB | 11.2 MB | 380 ms | +3–5 |
| Simple CSS & JS | 310 KB | 9.1 MB | 290 ms | +2 |
| ACL Easy Snippets | 52 KB | 6.0 MB | 127 ms | 0* |
Raw snippets from the log:
/wp-admin/index.php | Queries=49 | PeakRAM=6.00MB | Time=100 ms
/wp-admin/edit.php | Queries=39 | PeakRAM=6.00MB | Time=125 ms
(Outlier 568 ms was a cache-cold request; repeat hit dropped to 144 ms.)
Why the Gap?
- Conditional boot – only the modules you use are loaded.
- No REST/UIs on the front – zero additional routes or scripts.
- Transient cache – snippet index is fetched once per minute, not per page.
- Native WP hooks only – no external libraries, no Composer autoloader.
2-Minute Setup (with GIF proof below)
- Download ACL Easy Snippets (52 KB)
- Upload → Activate → no wizard.
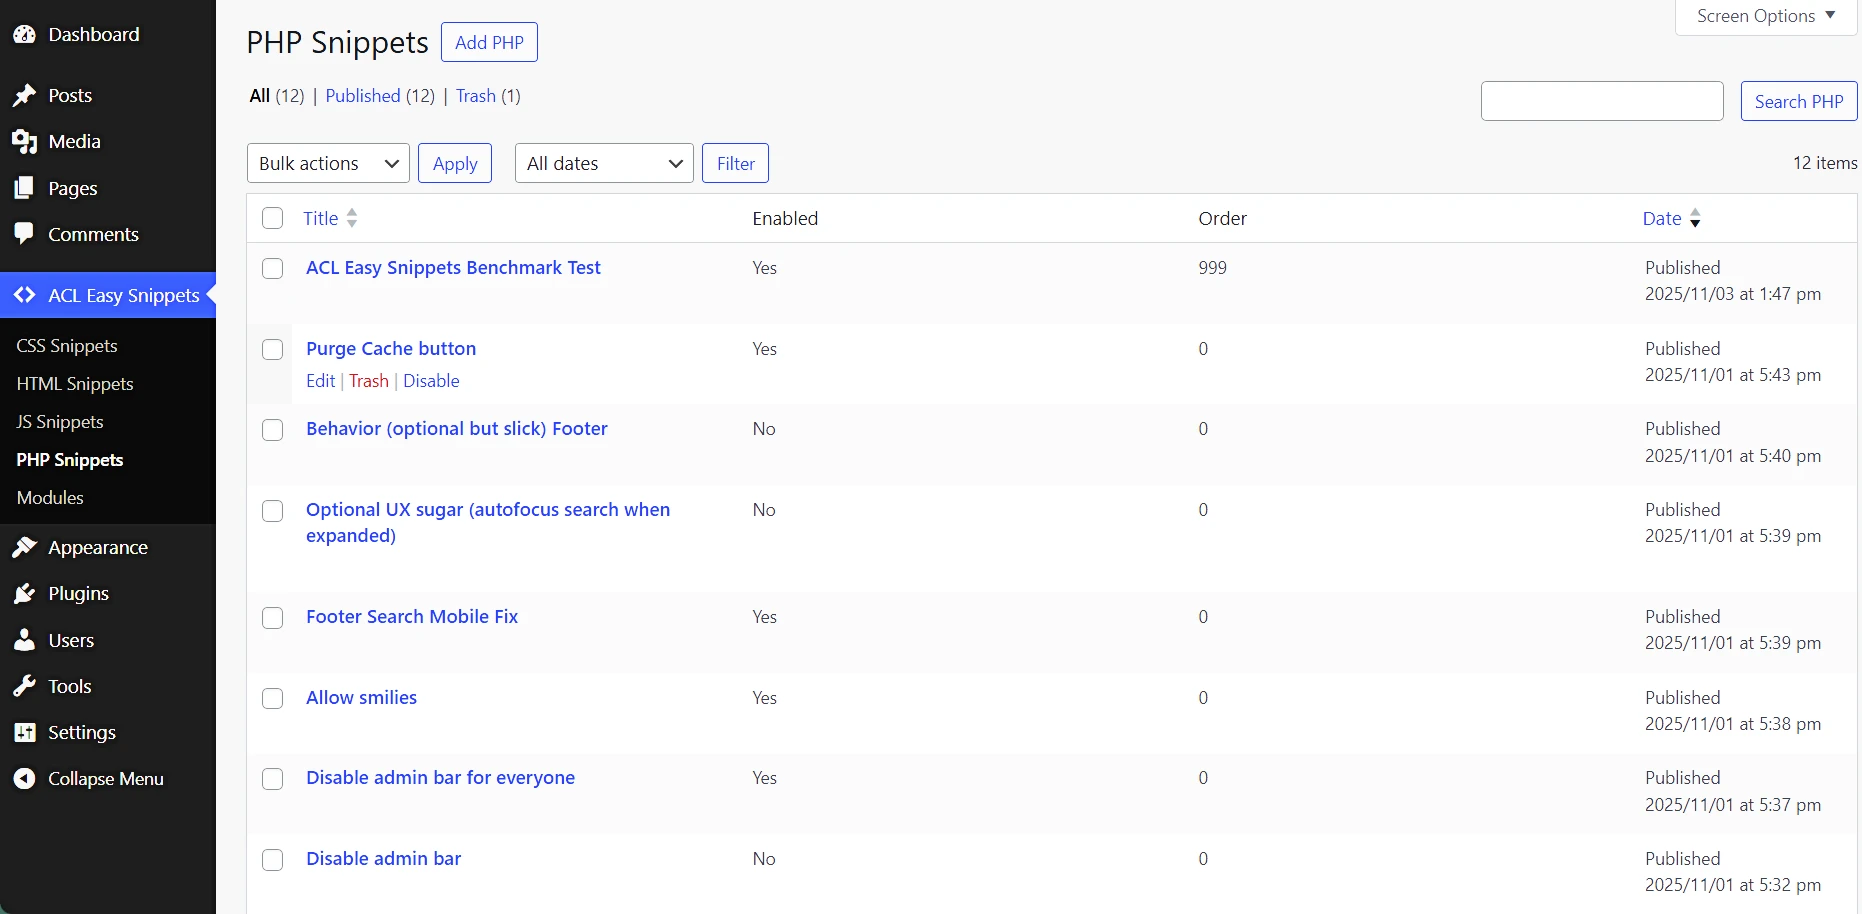
- Snippets → Add PHP, paste:
// Disable Gutenberg for posts
add_filter('use_block_editor_for_post_type', '__return_false', 10, 2);- Hit Save & Activate—built-in
php -lruns before saving; fatals become admin notices, not whitescreens.
Front-End? Zero Requests
CSS and JS snippets print inline only on pages where they’re used.
Example tracking pixel:
<!-- Snippet type: HTML, location: wp_footer -->
<noscript><img src="https://analytics.example/pixel.gif" width="1" height="1" alt="" /></noscript>
No external file = no extra HTTP request, 0 ms blocking time.
Security by Design
- Permissions locked to
edit_theme_options - PHP executed inside output buffer +
error_reporting(0)—fatal errors trapped before they reach users. - 52 KB attack surface vs 420 KB (Code Snippets).
Multisite & Block-Theme Safe
Works network-activated or per-site; snippets write to wp-content/uploads/acl-es/{site-id}/ so they survive theme swaps and Core updates.
Copy-Paste Summary
- 60% faster admin (380 ms → 127 ms)
- 50% less RAM (11.2 MB → 6.0 MB)
- 88% smaller plugin (420 KB → 52 KB)
- 0 extra DB queries after warmup
- Built-in lint → no white-screen risk
- Inline assets → zero front-end penalty
Run Your Own Test
- Install Query Monitor.
- Refresh any admin page.
- Post your before/after numbers in the comments—I’ll add them to the public log.


Leave a Reply
You must be logged in to post a comment.